
At the June 22nd school board meeting, I made statements comparing WGSD mil rates to other nearby districts. The purpose of my comments was to refute claims that Waterford’s school tax rate was substantially higher than other nearby districts. As the charts below show, the school tax rates for the Waterford area schools are near the average of other nearby K-8 school districts. Considering how well the Waterford Graded and Waterford UHS perform, it is safe to say that our current rate of school taxation is NOT causing families to move out of the Waterford area, or keeping new families from moving in.
Posted by Matt Kranich on 7/5/2015
WGSD Parent and WGSD School Board Member
Note: click on any chart below to enlarge
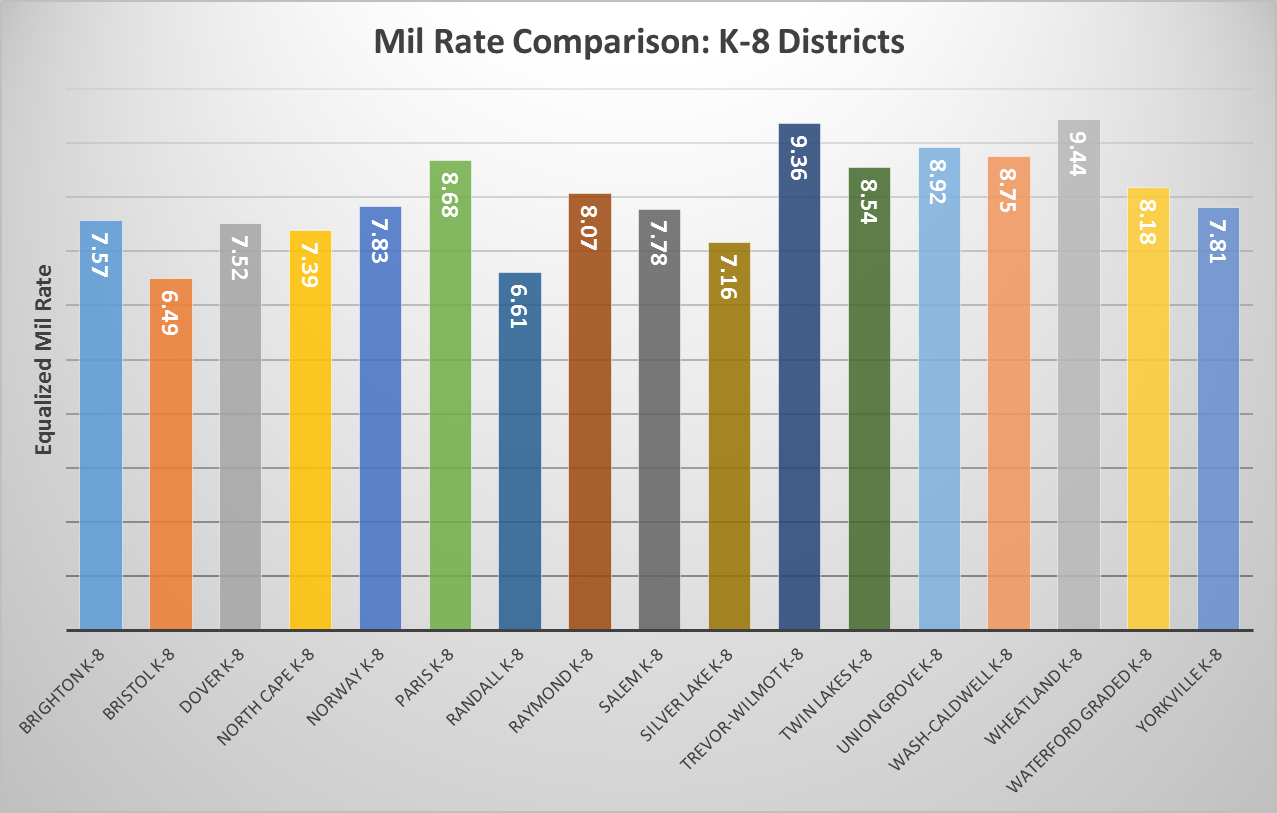
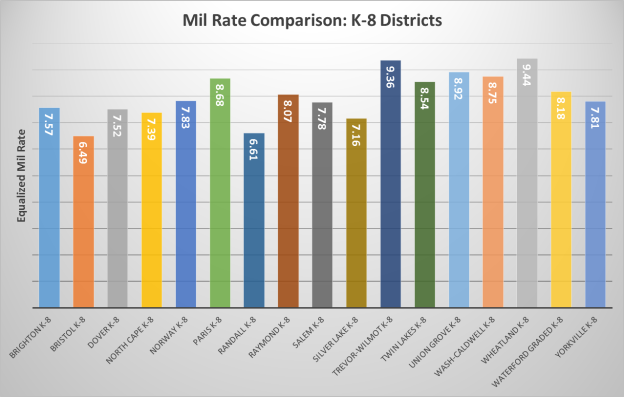
The graph above shows the data that school districts submit to DPI. Waterford Graded’s mil rate is near the middle of the pack, and not substantially higher than most other nearby K-8 districts. The mil rate is the amount of tax per $1,000 of property value.
The use of mil rates as a comparison of taxation is certainly limited because the local levy can change dramatically based on fluctuating property values, student enrollment, and state aid. In fact, if Waterford Graded could increase its enrollment by 100 students we could actually reduce the tax levy by a full 10%. This means that even after paying for the increased costs associated with adding 100 students, we would be able to reduce the tax levy by 10% because the state would send us an additional $1,300,000 each year in equalization aid. Learn more about how enrollment impacts Waterford Graded’s state aid calculation in my article titled: Declining Enrollment and the 4K Effect
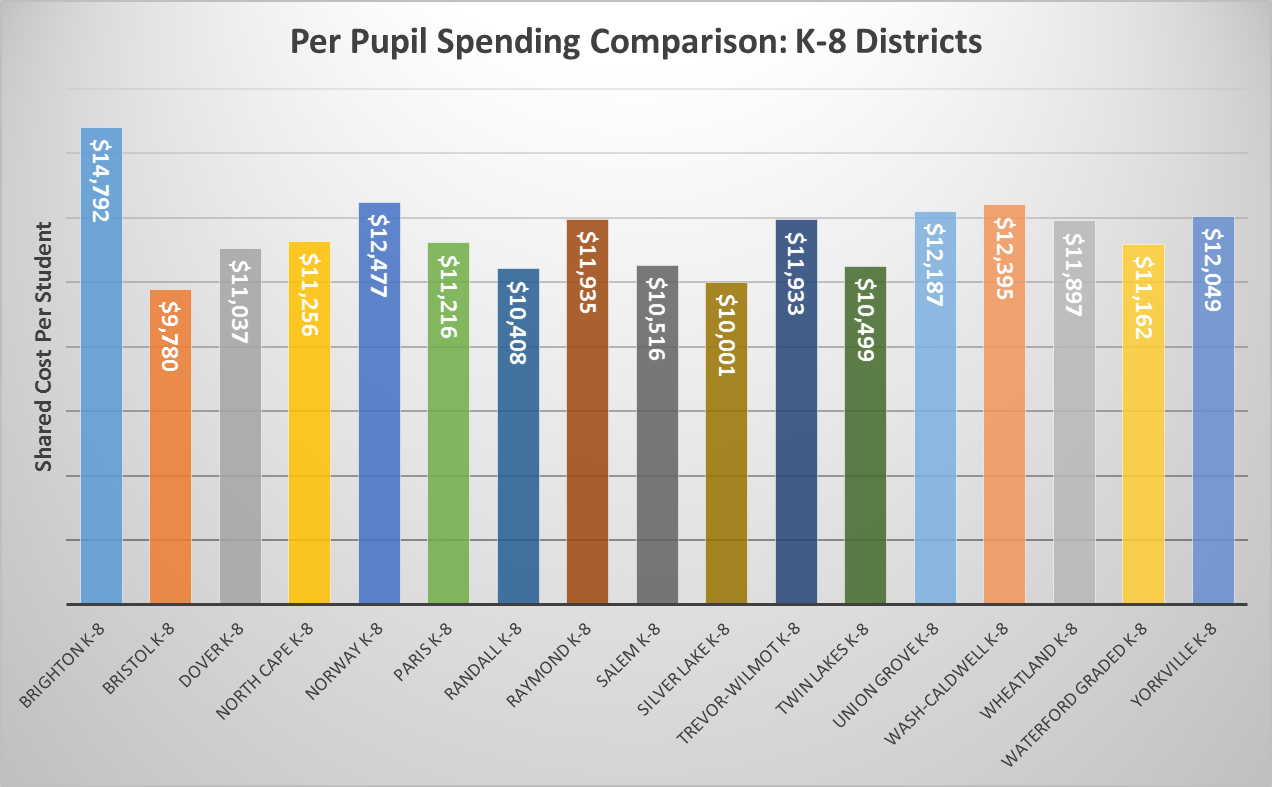
Another comparison for determining how school tax dollars are spent is to look at the per pupil spending. As shown above, Waterford Graded is slightly below the median for nearby K-8 districts in per pupil spending.
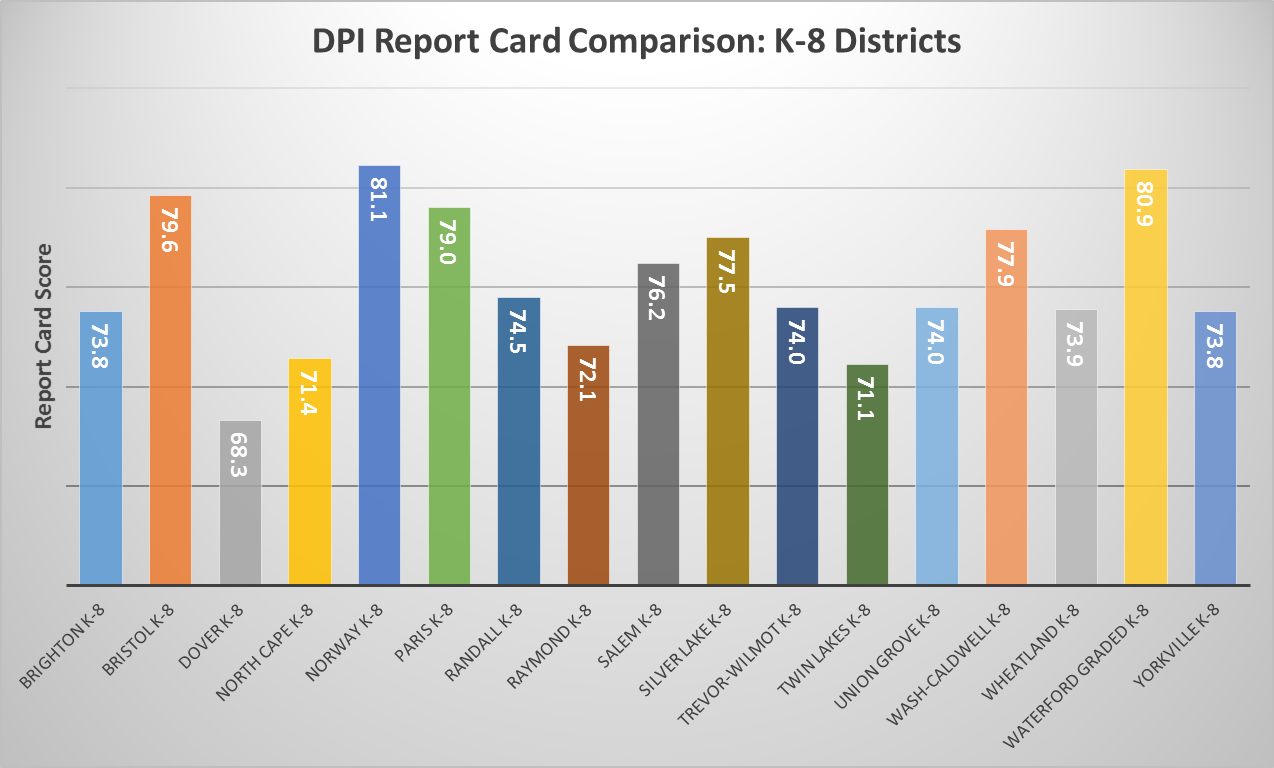
Fortunately, Waterford Graded has done well on standardized testing, despite recent issues related to staff morale and being one of only a few districts statewide that had not yet implemented a district-wide 4K program. As the graph above indicates, Waterford Graded is in a virtual tie for the lead on the state report card when compared to nearby K-8 districts. Just imagine what could have been, and what many expect will soon be, now that staff morale issues are being addressed, a new superintendent is starting this month, and district-wide 4K begins this fall for the 2015-16 school year. Not surprisingly, a recent news article ranked Waterford’s schools as the 6th best in the state.
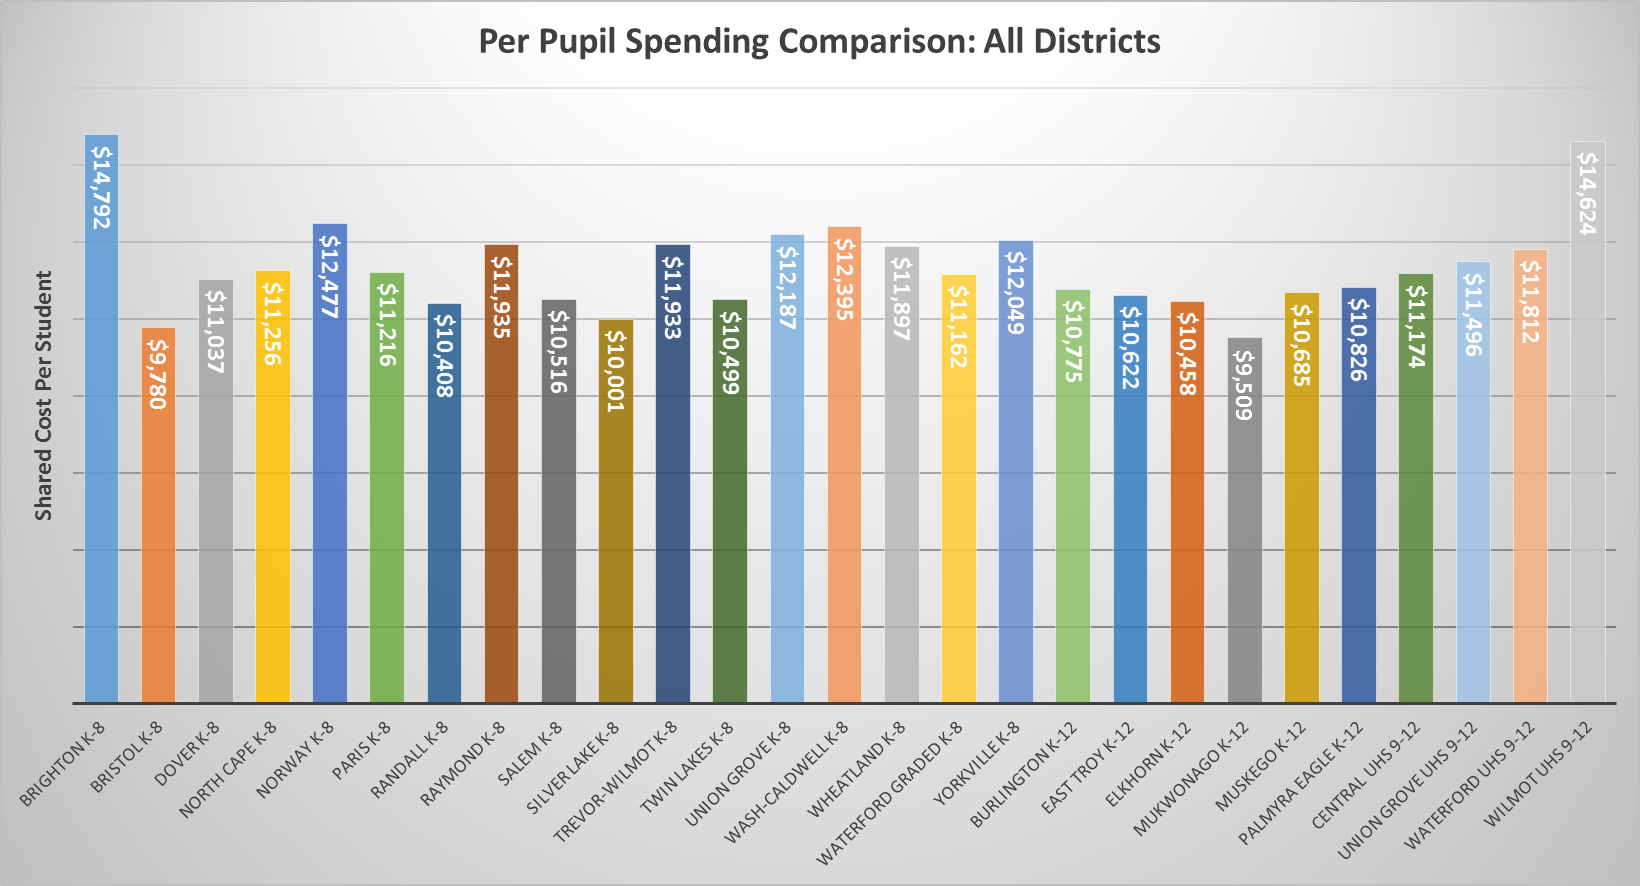
The chart above is a comparison of per pupil spending for all nearby school districts (in the order of K-8, K-12, and union high schools). The four nearby union high school communities used for comparison are Central/Westosha, Union Grove, Waterford, and Wilmot. Again, Waterford Graded is near the median of this group
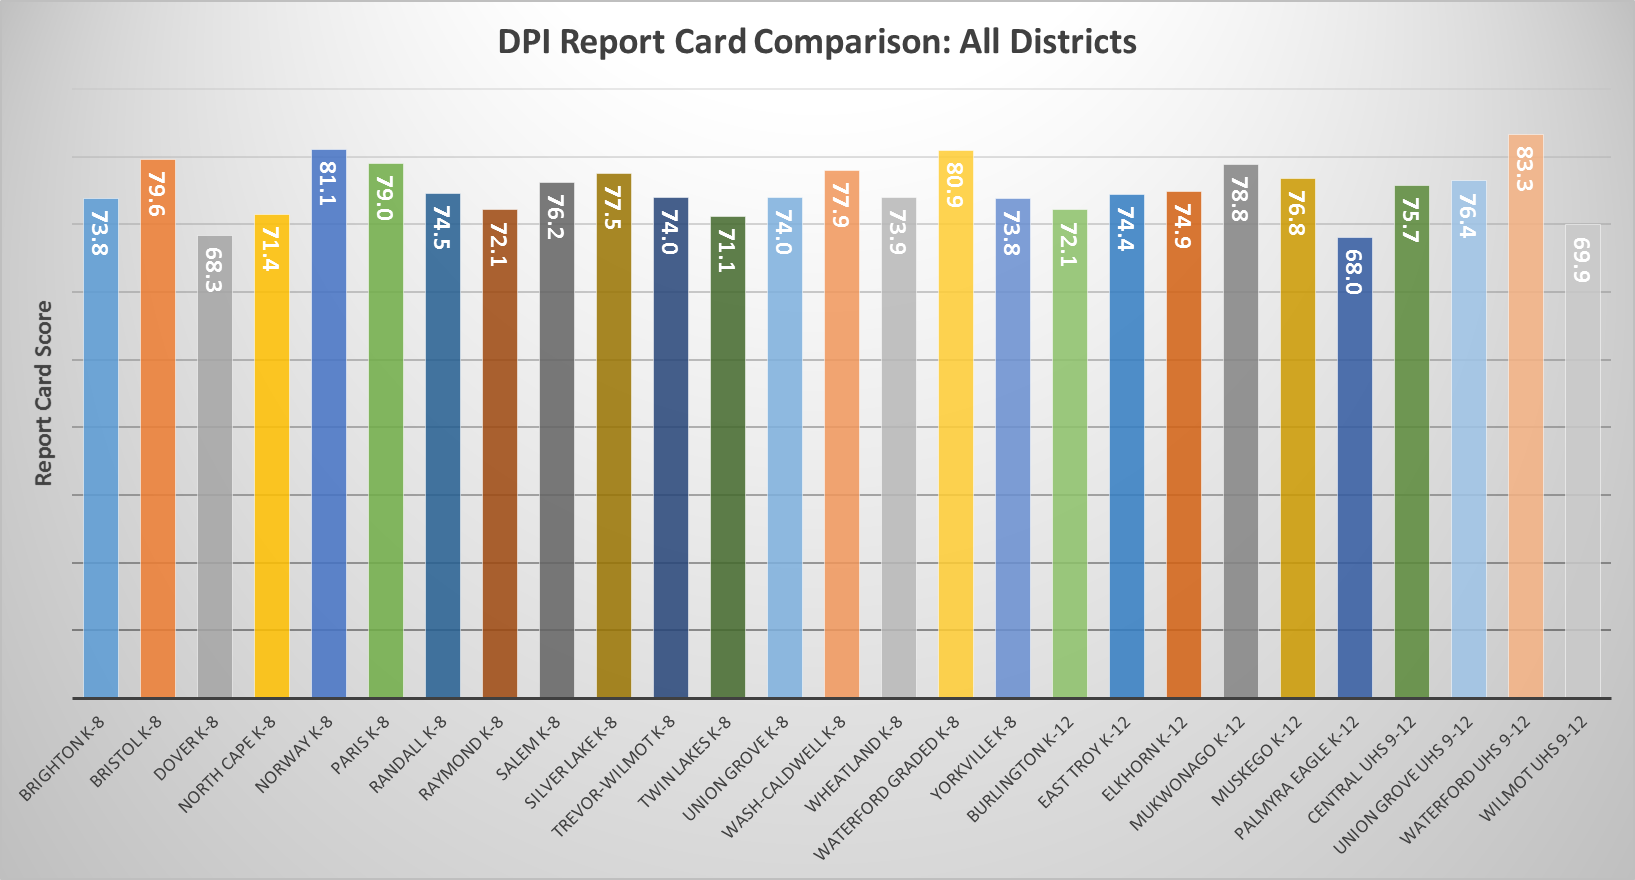
The chart above is a comparison of the DPI Report Card score for all nearby school districts (K8, K-12, and union high schools). The Waterford UHS leads the entire group, followed by a virtual tie between Waterford Graded and Norway (Drought School).
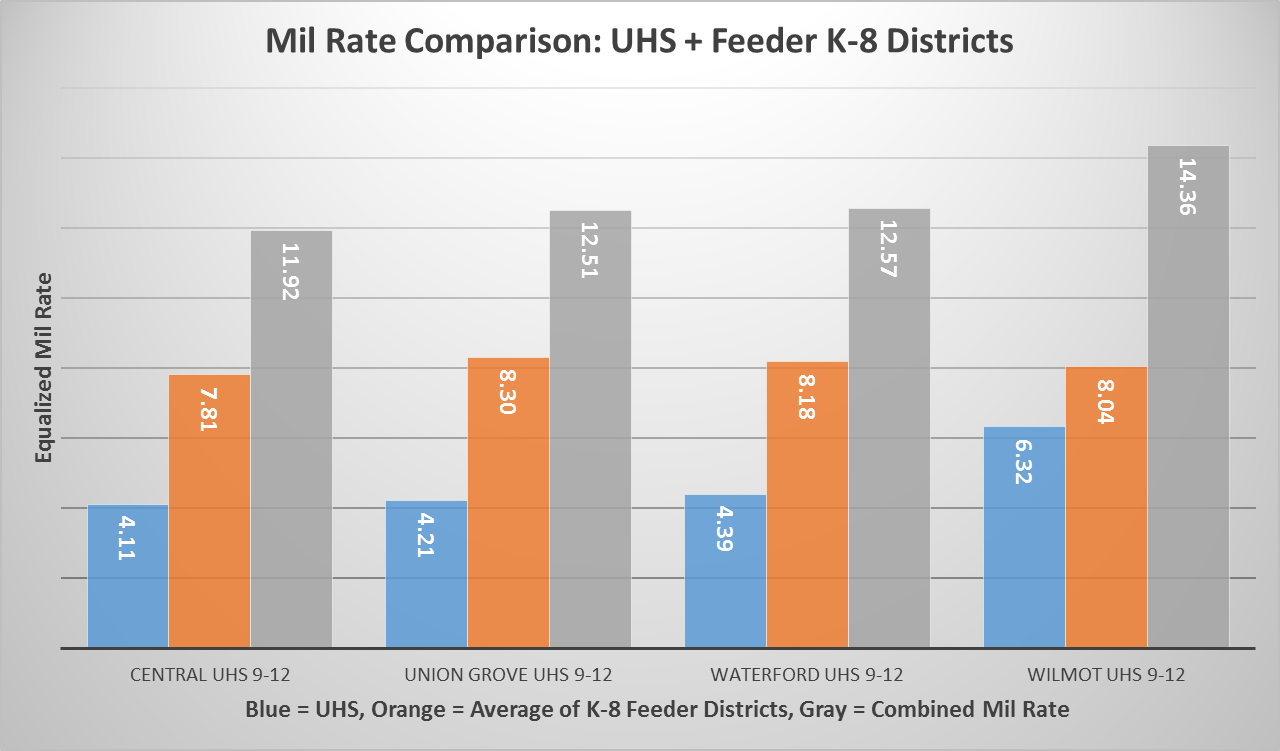
In our area, many communities have separate school districts that levy a tax on property owners. Waterford is an example of this, with the Waterford Union High School and the Waterford Graded J1 school districts both appearing on our property tax bills. As shown above, when the K-8 “feeder” district mil rate is added to the union high school mil rate Waterford is still about average for nearby districts with the same structure.
At the June 22nd school board meeting, I made an error when comparing Waterford Graded’s tax levy to that of other districts because some of them were K-12 school districts. This was an unfair comparison because a K-8 district, like Waterford Graded, does not have to educate students in grades 9-12, as do K-12 unified districts, such as Burlington. This unfair comparison was certainly not done intentionally, but rather out of haste and simply running out of time to separate the data I had collected before getting to the meeting.
However, comparing a K-12 district, such as Burlington, to the “sum” of the union high school mil rate and the K-8 mil rate is also unfair. For example, the 9-12 union high school district and the K-8 graded school district both need to employ a superintendent of schools. They also cannot as easily share other staff such as curriculum and technology administrators, secretaries, and numerous other staff positions.
The decision to switch to a unified K-12 district in Waterford is not the decision or responsibility of any one school board. If Waterford and the surrounding communities want to again try and combine their K-8 school districts with our Waterford UHS they will need to weigh the pros and cons and put it to a referendum vote. To learn more, see the DPI rules on district consolidation of union high schools and their underlying K-8 districts.
Posted by Matt Kranich on 7/5/2015
WGSD Parent and WGSD School Board Member
Note: For the chart titled “Mil Rate Comparison: UHS and Feeder K-8 Districts” the K-8 mil rate used for the “Waterford Area” is that of Waterford Graded, while for the other 3 union high school communities a weighted average of the K-8 feeder district mil rates was calculated [(sum of enrollment multiplied by the mil rate for each K-8)/ total enrollment] and then added to the respective union high school tax mil rate.
All data used comes from the following DPI spreadsheets using only “final” values, not estimates.
http://sfs.dpi.wi.gov/sites/default/files/imce/sfs/xls/multiyear_rl_0405%20to%20current.xls
http://sfs.dpi.wi.gov/sites/default/files/imce/sfs/xls/longitudinal_eq_0405_1516.xls
If any errors are found, please let me know and I will make the needed corrections. Thank you!